НТУГ-ын удирдлагууд дэлхийн хэмжээний бизнес консалтинг, санхүүгийн зөвлөх үйлчилгээний тэргүүлэгч “Alvarez&Marsal” компанийн төлөөлөгчдийг өнөөдөр /2026.03.31/ Улаанбаатар хотноо хүлээн авч уулзлаа.
“ТУУЛ УСАН ЦОГЦОЛБОР” ТӨСЛИЙН ТЕХНИК, ЭДИЙН ЗАСГИЙН ҮНДЭСЛЭЛИЙГ БОЛОВСРУУЛЖ БАЙНА
НИЙСЛЭЛ ДОТООД БОНД ГАРГАЖ, ДЦС-5 ТӨСЛИЙГ 200 ТЭРБУМ ТӨГРӨГӨӨР САНХҮҮЖҮҮЛНЭ
“Нэгдсэн төслийн удирдлагын газар” ОНӨТҮГ, “Барилгын хөгжлийн төв” ТӨҮГ хооронд хамтран ажиллах санамж бичгийг /2026.03.27/ байгуулж, НТУГ-ыг захирал Э.Түвшинжаргал, Барилгын хөгжлийн төвийн захирал Д.Мөнхбаатар нар гарын үсэг зурлаа.
ДУЛААНЫ ТАВДУГААР ЦАХИЛГААН СТАНЦЫН ТӨСЛИЙН БАРИЛГА УГСРАЛТЫН БЭЛТГЭЛ АЖИЛ ЭРЧИМЖИЖ БАЙНА
ИОРДАН УЛСЫН ХҮН АМЫН ТАЛЫГ ЦЭВЭР УСААР ХАНГАХ "AQABA-AMMAN" ТӨСӨЛ ХЭРЭГЖИЖ БАЙНА
ДҮҮЖИН ЗАМЫН ТЭЭВРИЙН ТӨСЛИЙН ХОЁР БУУДЛЫН БАРИЛГЫН АЖИЛ ДУУСАЖ, ДОТООД ЗАСАЛ ХИЙГДЭЖ БАЙНА
БАЯНХОШУУ НОГООН ОРОН СУУЦ ТӨСӨЛ: 226 АЙЛЫН 6 БЛОК ОРОН СУУЦНЫ БАРИЛГЫН АЖИЛ 80 ОРЧИМ ХУВЬТАЙ БАЙНА
ХАНЫН МАТЕРИАЛ ХОТ ОРОН СУУЦЖУУЛАХ ТӨСЛИЙН БҮТЭЭН БАЙГУУЛАЛТЫН БЭЛТГЭЛ АЖЛУУД ЭХЭЛСЭН
НТУГ-ЫН ИНЖЕНЕР, МЭРГЭЖИЛТНҮҮД ГАМШГААС ХАМГААЛАХ СУРГАЛТАД ХАМРАГДЛАА
“СЭЛБЭ 20 МИНУТЫН ХОТ” ТӨСӨЛ: 3660 ХҮҮХДИЙН ГУРВАН СУРГУУЛЬ, 1200 ХҮҮХДИЙН ТАВАН ЦЭЦЭРЛЭГ БАЙГУУЛНА
ГЕОЛОГИЙН ТӨВ ЛАБОРАТОРИ ОРЧМЫН НҮХЭН ГАРЦЫН ГАЗАР ЧӨЛӨӨЛӨЛТ ДУУСЛАА
НТУГ-ЫН ДОТООД АУДИТОРУУД ISO 9001:2015 БОЛОН ISO 21500:2021 СТАНДАРТЫН ХЭРЭГЖИЛТЭД ДҮГНЭЛТ ХИЙЖ АЖИЛЛАЛАА
ДҮҮЖИН ЗАМЫН ТЭЭВЭР ТӨСЛИЙН ЯАРМАГ ДАХЬ БУУДЛЫН ЭРГЭЛТИЙН ЗАМЫГ СУУРИЛУУЛЛАА


09 01

Within the Feasibility Study, an “OD & SP” survey was conducted with 2,825 residents within a 1 km radius of the metro station.

Within the Feasibility Study, an OD & SP Survey on Residents’ Travel Behavior Was Conducted

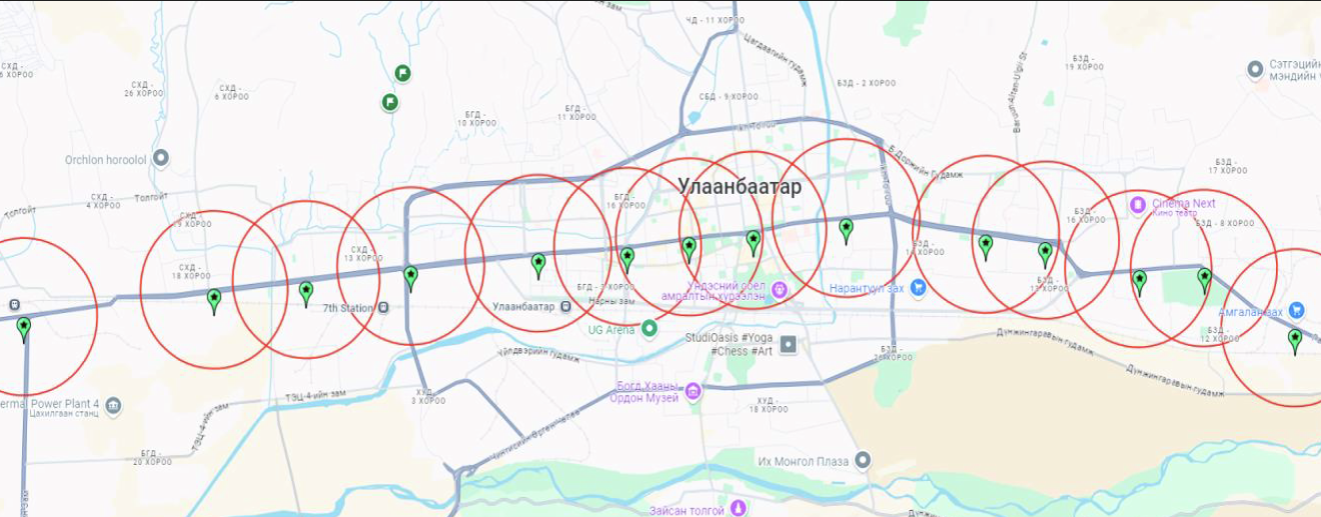
As part of the project, an Origin-Destination (OD) and Stated Preference (SP) survey was conducted to assess residents’ travel demand. The survey covered 2,825 residents living within a 1 km radius of the newly planned metro station along Peace Avenue in Ulaanbaatar. Data collection was carried out in accordance with approved methods and procedures from October 23 to November 17, 2024, following the ISO 20252:2012 standard throughout the process. Below is a summary of the main survey findings:

Satisfaction and Household Transport Use:

  • On average, each respondent spends 29,674 MNT per month on public transport buses, 263,307 MNT on private car fuel, and 68,926 MNT on other transport modes such as taxis or scooters.
  • 75% of surveyed households reported having a private car, while 14% own a bicycle.
  • Satisfaction with public bus services varied: 47% were satisfied, while 34% were dissatisfied. Satisfaction tended to increase with age, with only 41% of respondents aged 18-25 reporting satisfaction.
  • Detailed analysis showed that 91% were satisfied with bus fares, 72% were satisfied with bus stop accessibility, but only 32% were satisfied with buses arriving on time. Cleanliness inside buses and drivers’ courtesy scored low, with 33-35% of respondents dissatisfied.

Challenges in Urban Transport:

  • Key issues for private car travel included insufficient parking (62%), poorly planned roads/intersections (50.4%), and lack of road lanes (44.3%).
  • Public transport challenges included overcrowded buses, with 53.1% reporting buses often not arriving on time and 31.3% citing insufficient routes.
  • Walking and cycling faced issues due to inadequate pedestrian and bike paths.

Travel Patterns:

  • Surveyed residents averaged 2.74 trips per day. 28% made 2 trips/day, 20% made 3 trips, 13% made 4 trips, and 8% made 5 or more.
  • Morning peak travel starts at 7:00 and declines by 10:00; evening peak starts at 17:00 and decreases after 20:00.
  • Trip purposes: 38.5% returning home, 24.9% commuting to work, 8.8% shopping, 5.5% school/pick-up/drop-off. Educational-related trips (school, lessons, child drop-off/pick-up) accounted for 77% of total trips.
  • Modes of travel: 40.7% drove their own car, 6.3% were passengers, 4.4% used taxis, 30.9% used public buses, 16.5% walked, with cycling, scooters, and motorcycles used minimally. 25% of bus trips involved transfers, indicating the need to improve bus routes.

Metro Perceptions and Fare Expectations:

  • When presented with four alternative travel scenarios, over 83% of respondents indicated they would choose the metro, with the highest preference (87%) for Scenario 3. Preferences did not significantly vary by age, gender, or employment.
  • Potential metro fare: 66% willing to pay up to 1,000 MNT, 21% could pay 2,000 MNT or more, and 12% could pay 1,500 MNT. Average fare respondents could pay: 1,379 MNT. Maximum fare willingness: 27% up to 1,000 MNT, 35% 1,500-2,000 MNT, 33% 3,000-5,000 MNT, 4% over 5,000 MNT; average maximum fare: 2,625 MNT.
  • Fare preferences: 62% prefer a flat fare regardless of distance, while 38% prefer distance-based pricing. Preferences vary with age and income: 74% of 18-25-year-olds prefer a flat fare, decreasing with age; higher monthly income respondents tend to prefer distance-based pricing.

This survey provides critical insights into Ulaanbaatar residents’ travel patterns, satisfaction with current transport services, and potential adoption and pricing expectations for the new metro system